Advanced Custom Data Visualization Solutions

Visualizing and organizing company intelligence improves your organization's productivity.
We take it a step further. We can also develop custom dashboards for you that interact with the rest of the VisualApps Suite™ platform.

Let us help you with an expert evaluation of your business intelligence needs, beautiful dashboard applications for you to visualize data, and workflow automation systems that help your team be more productive. We will also allow you to view information relevant to you with custom charts and tables.

Your business can become more efficient by using our custom visualization solution. It will help prioritize essential decisions easier and highlight significant trends your company may have otherwise missed.

At Paradigm Interactive, we recognize that each business is unique and requires custom data visualization solutions to fit its needs and limitations. So we will work with you and find a solution that suits your company precisely.

Our team of experts can help:

  • Evaluate the different types of information your organization deals with
  • Develop a solution with the best-in-class technology and tools that work within your company's budgetary and technological limitations
  • Create beautiful dashboard applications and workflow automation systems for your business
  • Create management, team, and owner views with custom charts, tables, and more
  • Integrate with your business's internal processes and services
  • Enable data exploration, data-drill down, and visual analytics of your business data


Image

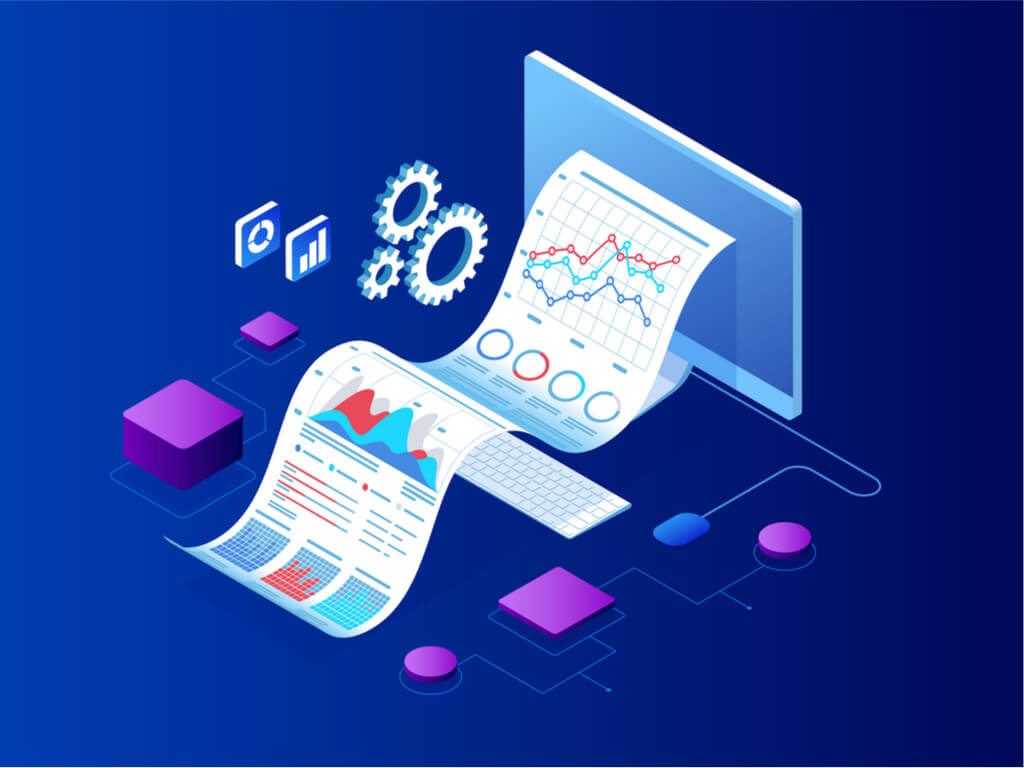
Business Intelligence and Custom Data Analytics

Filing the same reports week after week?

Have a glance at your boardroom table. The chances are that every executive has a laptop or tablet with them. If you have reports that need to be understood, then hand over the data to us and let us build an interactive dashboard for it.

When your executives have a way to get the data they need, there will be less wasted time spent in meetings standing around reading a report. Instead, they can pull up whatever details they're interested in on their device and get right back to work.

The system will also save you money, as you don't have to produce hard copies of reports every week. Instead, you can send out a direct link to your custom report page.

It's simple enough that anyone can use it on their own time, without needing any training or contact with IT.

We offer:

  • A scalable, fully-featured web platform for charts, tables, graphs, forms and interactive visuals
  • Report generation from dashboards for external sharing and communication
  • Intuitive data presentation technologies and user interface systems
KPI Design

Enabling Data-Driven Decision Making

Today's business world is highly competitive. With increasing market pressures, organizations need to become more agile and efficient to remain profitable. Enabling data-driven decision-making within your organization can significantly improve business performance.

By having the right tools to combine, organize, visualize and analyze data in real-time, your company can make quick decisions positively impacting the bottom line. Access to data plays a pivotal role in improving the decision-making process within organizations.

  • Use data to understand better customers' buying patterns, customer churn rates, marketing campaign effectiveness, inventory levels, and much more
  • Create a culture of innovation with limitless options for customization within our platform
  • Insights into your business's KPIs will provide immense value cross-organization

Let's work together

With our advanced analytics capabilities built into every application, you are empowered to gain valuable insights.